Edvisor Recruit: Reports and Analytics
Learn about accessing the 'Reports' and 'Analytics' sections and how to generate Reports to download.
Currently, you will be able to find Reports and Analytics inside the Tools feature.
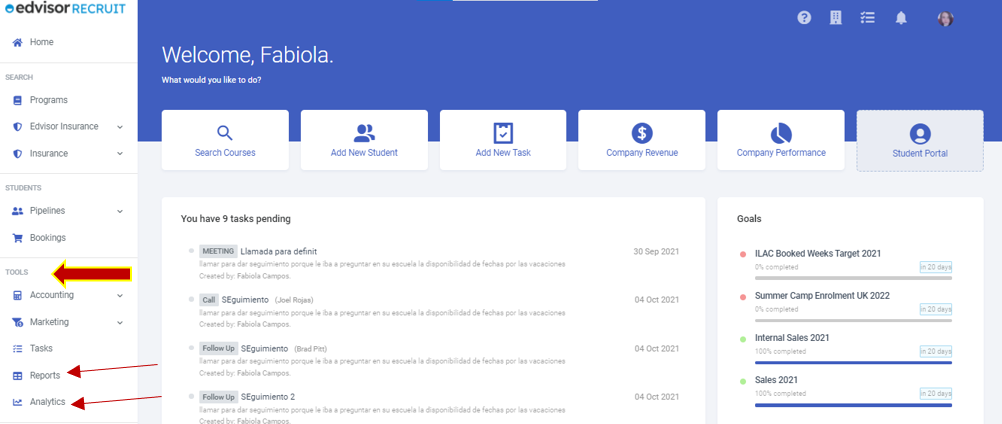
Reports
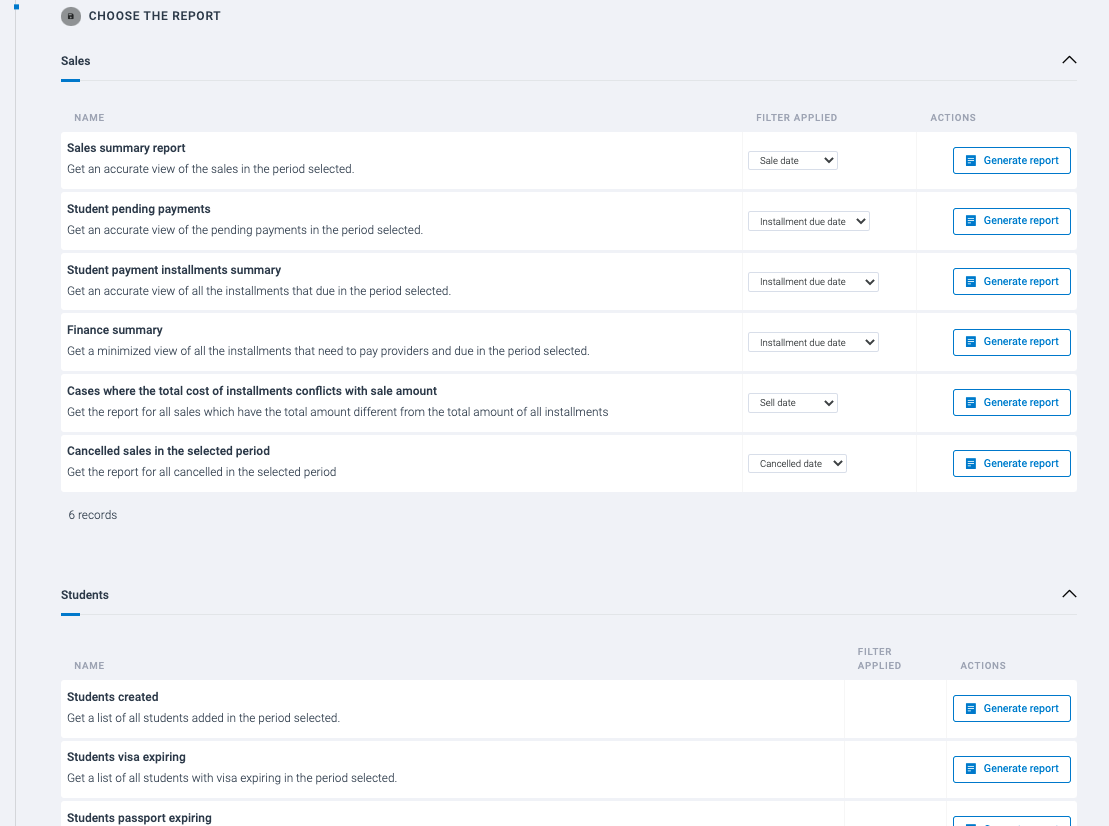
Reports allow you to extract your data in almost any area of your business. From Student info to recorded Payments, you can choose from the many pre-built default reports, or create your custom reports to download.
Default Reports
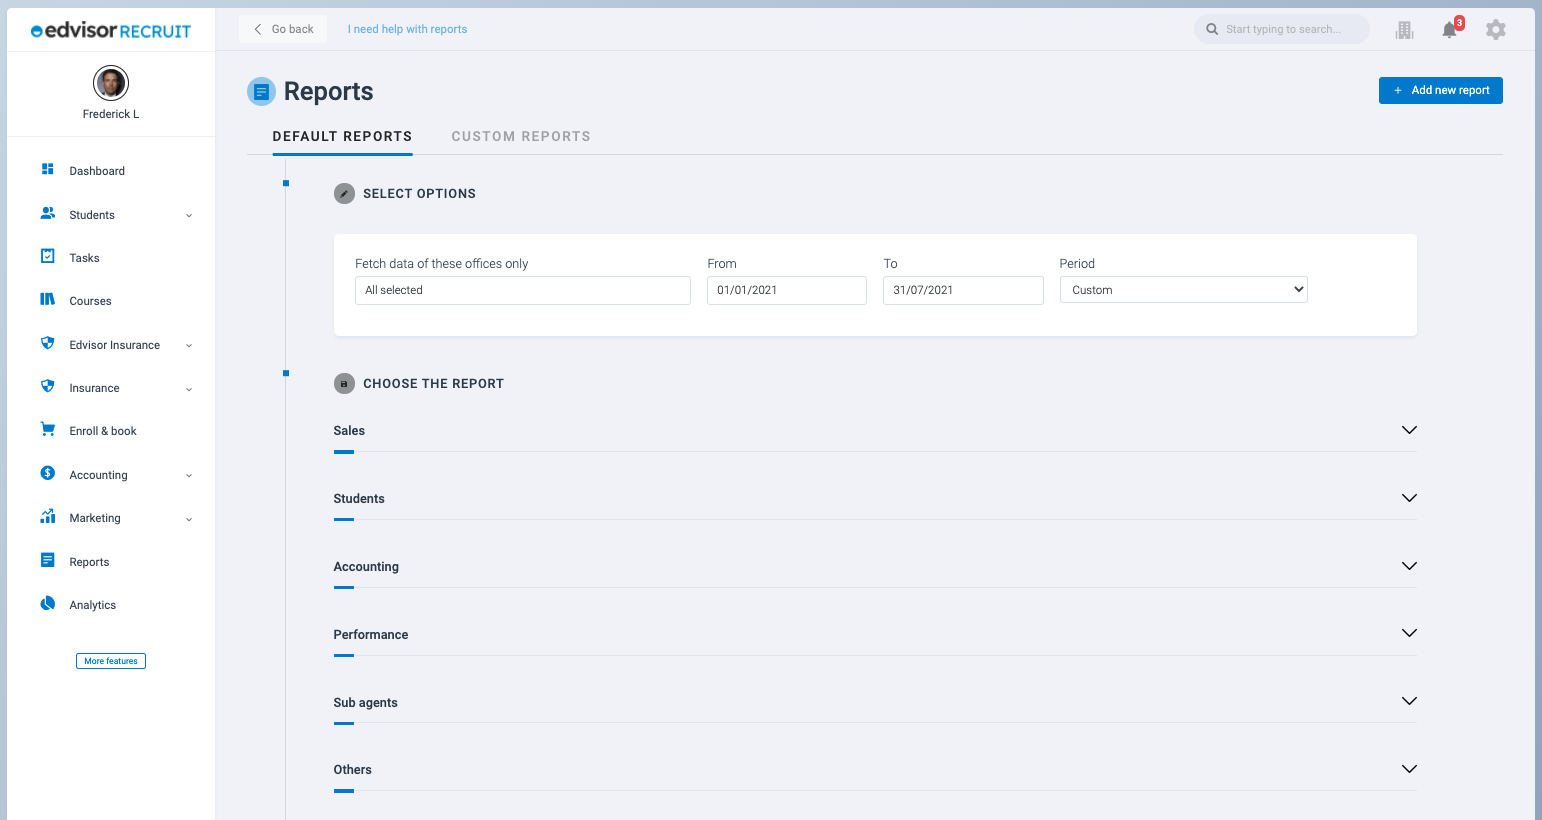
Filters
Filter your reports by Office and date range, before you generate them, or access the Data Playground. Once you click on 'Generate Report', you will see a button to 'Download' the file (CSV).
Data Playground
You will also see a button that says 'Data Playground'. Clicking this will take you to a page where you can manipulate the data starting with the default report that you had selected.
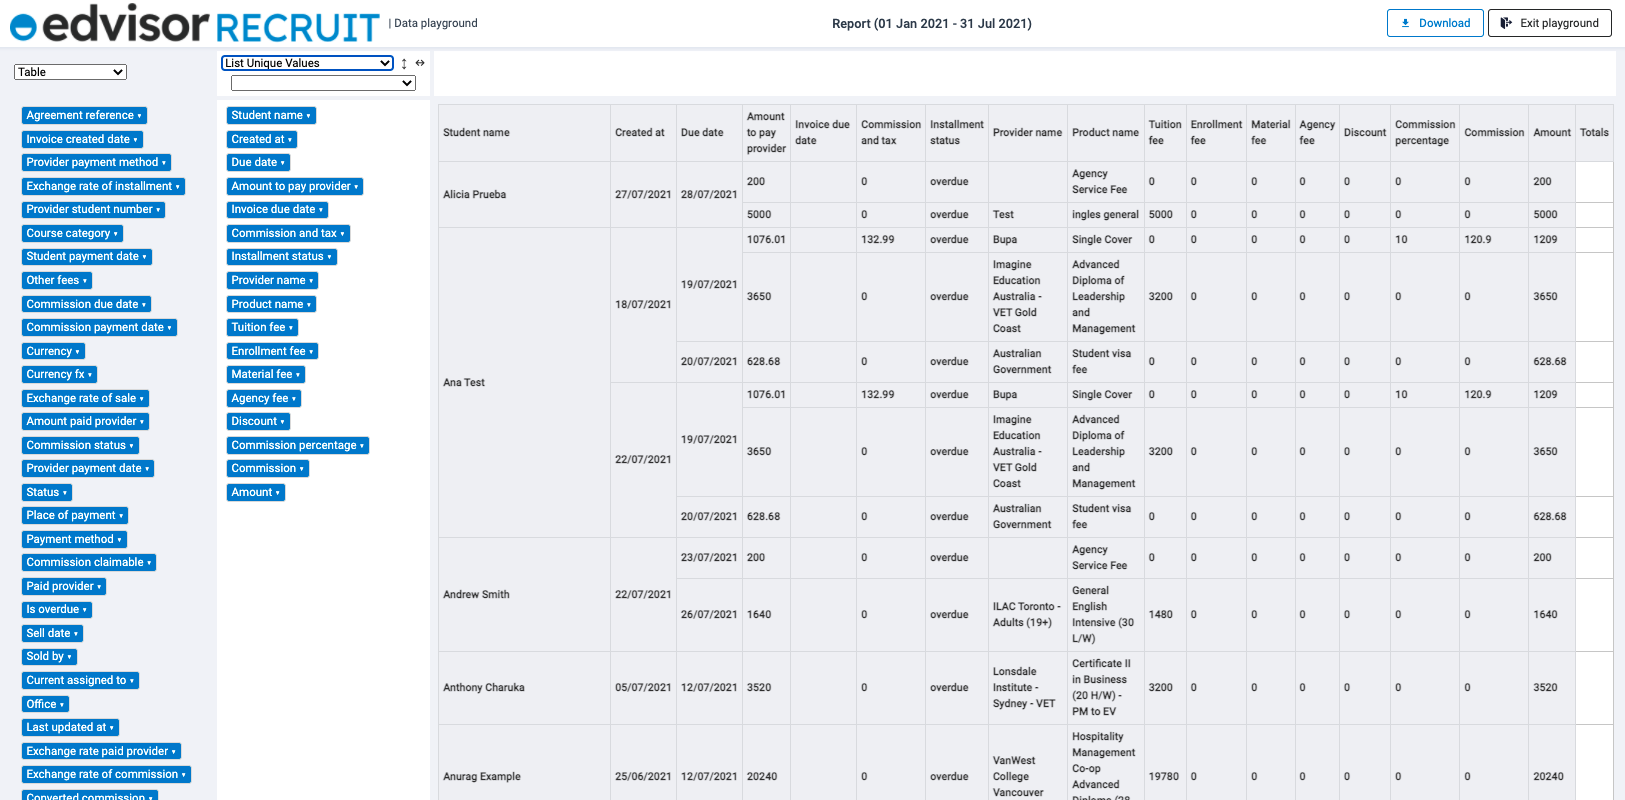
Pro Tip: Data Playground uses pivot table elements
The Data Playground is also available for any custom reports you decide to create and save.
Custom Reports
Can't find a Default Report that you like? That's where Custom Reports come in. Start a new report from scratch, and save it to be pulled anytime you want. All the Report functionality (generate and data playground) are available.
Analytics
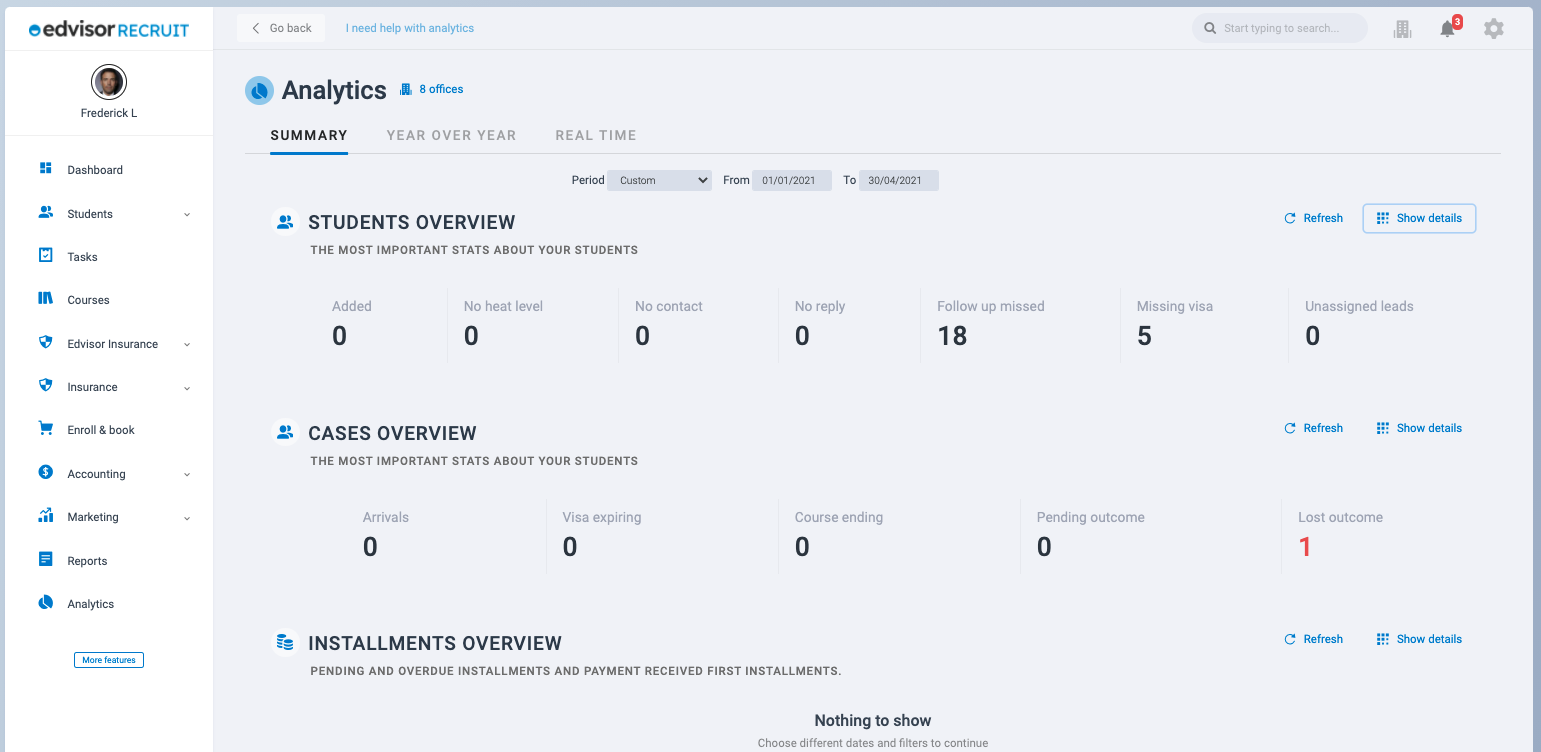
The Analytics section is a static 'mini-dashboard' that relates to Reports. The elements displayed on Analytics can be expanded to view more details.
You can also adjust the Office and custom Date Range filters to change the data that is displayed.
If you are looking for more specialized reports, check out the Custom Reports section as explained above.
NEXT: Forms and Website