How to Use the Quotes Reporting Tool
A quick guide to understanding and using the quotes dashboard to track activity and spot trends.
Our reporting tool helps you track your performance in Edvisor. Whether you want to understand how many quotes you or your team have created, how many students accepted them, or which programs are getting the most attention, this is where you’ll find it.
Let’s break it down step by step. 👇
Where to Find the Quotes Report

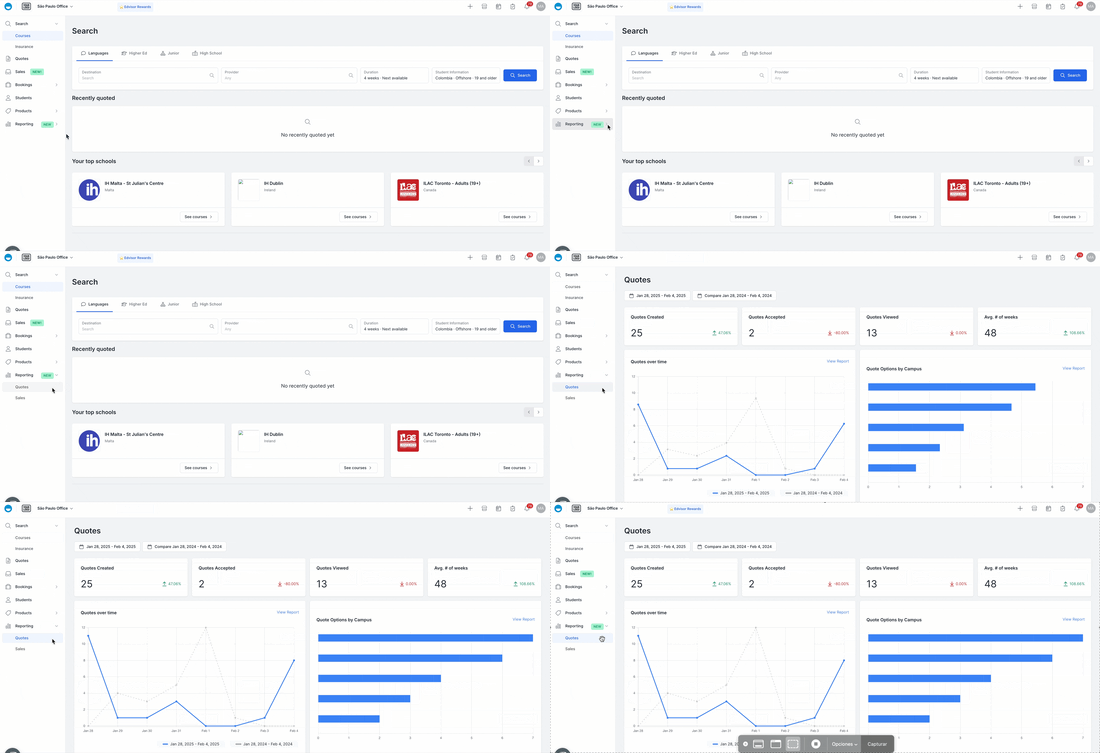
- Go to
Reportingin your Edvisor dashboard. - Select
Quotesfrom the menu desplegable. - You’ll land on the Quotes Overview Dashboard.
Understanding the Main Dashboard
The main dashboard gives you an overview of all key metrics.
Summary

- Quotes Created: Total number of quotes created in the selected date range.
- Quotes Accepted: How many of those quotes were accepted by students.
- Quotes Viewed: How many quotes were opened/viewed.
- Avg. # of Weeks: The average program length of the quotes you created.
💡 You can compare two date ranges (e.g., this week vs last year’s same week) to spot trends.
Visual Charts
Scroll down to explore additional insights. Each chart includes a ‘View Report’ option for a detailed breakdown.
| Quotes Over Time A line chart showing how many quotes you created each day. 💡Great for spotting busy days or seasonal trends. Click “View Report” to see quotes created and accepted by office, counselor, or campus. |
 |
| Quote Options by Campus A bar chart that shows the top campuses you’re quoting the most. 💡Hover over each line in the chart to see the campus name Click ‘View Report’ for a detailed overview, and filter by counselor, campus, or office. |
 |
|
Quote Options by Program Type Click ‘View Report’ for a detailed overview, and filter by counselor, campus, or office. |
 |
|
Quotes by Counsellor: Click ‘View Report’ for a detailed overview, and filter by counselor, campus, or office. |
 |
|
Quote Options by Destination: Click ‘View Report’ for a detailed overview, and filter by counselor, campus, office or program type! |
 |
Drilling Down: Filters and View Report
Using the date fields, you can view all reports for any time range and even compare different periods.
Click View Report on any section to get more details:
For example:
- Filter by Office, Counsellor, or Campus.
- Compare with previous periods.
- See detailed performance trends.
💡 Pro Tips
Quote Reports show you how many quotes you’ve created, which programs and destinations are most popular, and how your team is performing, all in one dashboard!
Use these insights to:
✅ Spot Trends – See which destinations and programs are in demand to adjust your marketing strategy.
✅ Boost Team Performance – Track quotes by counselor to reward top performers and support others.
✅ Go Beyond Quotes – Compare quotes created vs. accepted. For a deeper look at sales performance, check out the Sales Reports.